The objective of this work is to analyze the production of iron and steel using machine learning. The data was obtained from web sites of the specialty and gives a greater emphasis to the production in South America and Brazil in particular.
The information was collected on the websites:
The information about year 2018, is real information from January to October 2018 and is projected to November and December 2018, because we are ending November 2018.
This work also trains the use of interactive maps of the folium package, to present the statistics. I used the Collaborative Jupyter Notebook, from Google, to made this work. Complete python work is in Github.
The data sources to create graphs are in Github (folder data) in excel format.
Let’s go work.
Because I am in collaborative jupyter, I read the files to the platform with code:
Need install package xlrd to read excel files.
Files to read:
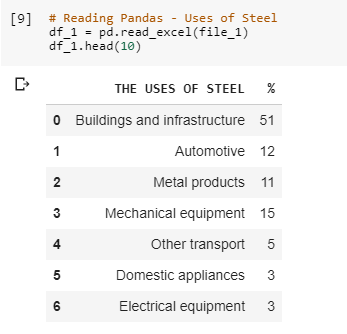
Some read tables from excel:
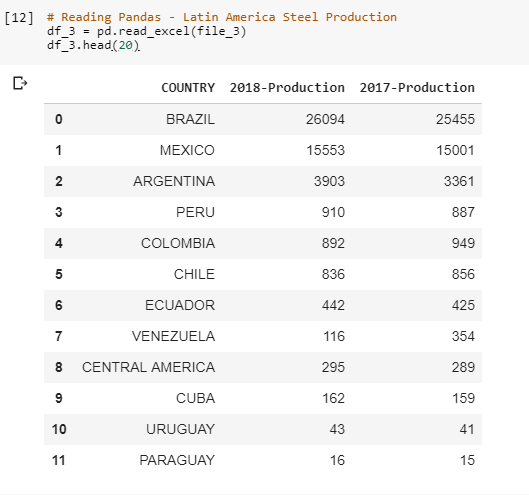
Table with Latin America production:
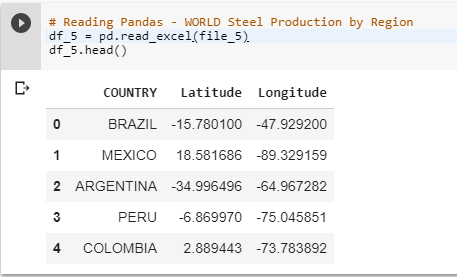
I created a file with geo-coordinates from latin america countries, to plot stats in a map:
Printing Graphs:
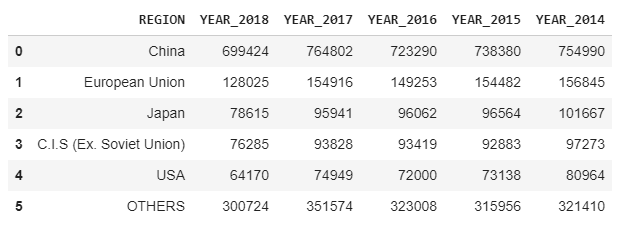
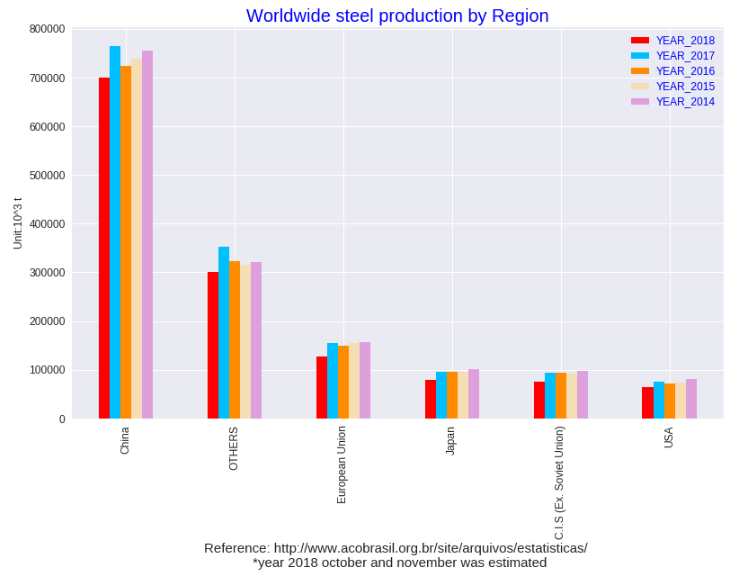
Steel Production By Region
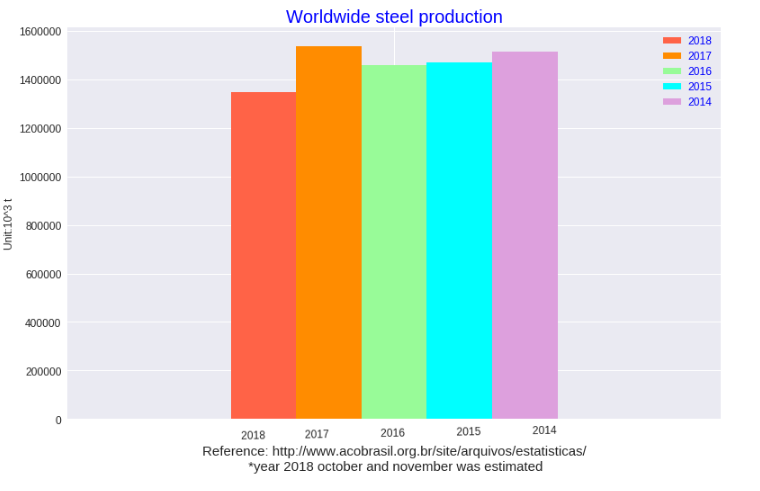
The graph shows a decline in iron and steel production in 2018 in all markets.
Making a Sum of all markets:
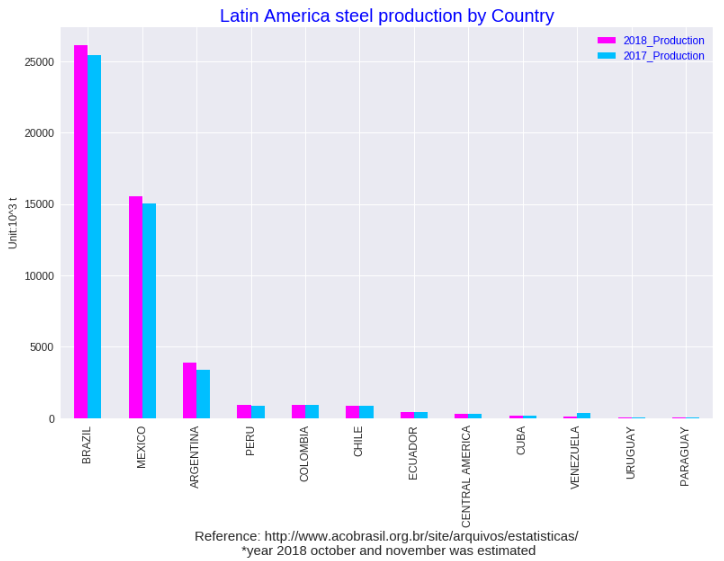
Latin America Production
Creating Maps with Folium package
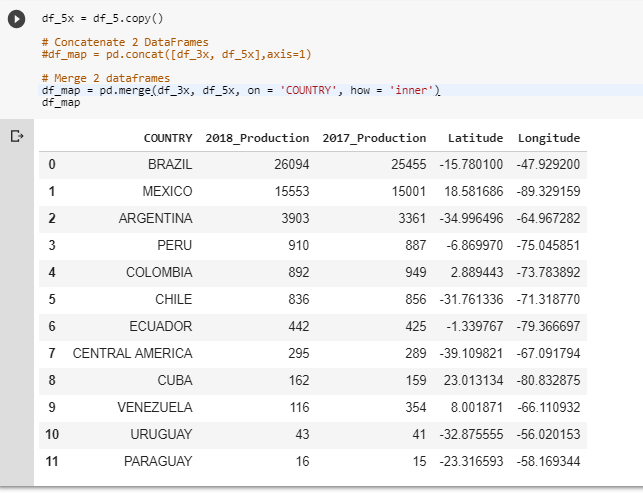
I made a merge with the Latin America table with the table with geographic data:
We need install folium package, to create interactive maps:
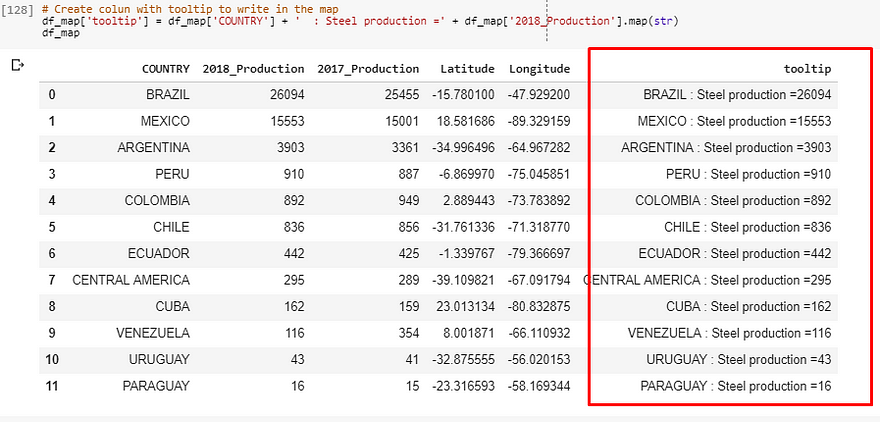
I create a new column in the dataframe to make the tootip that i want to present un the flag-mark.
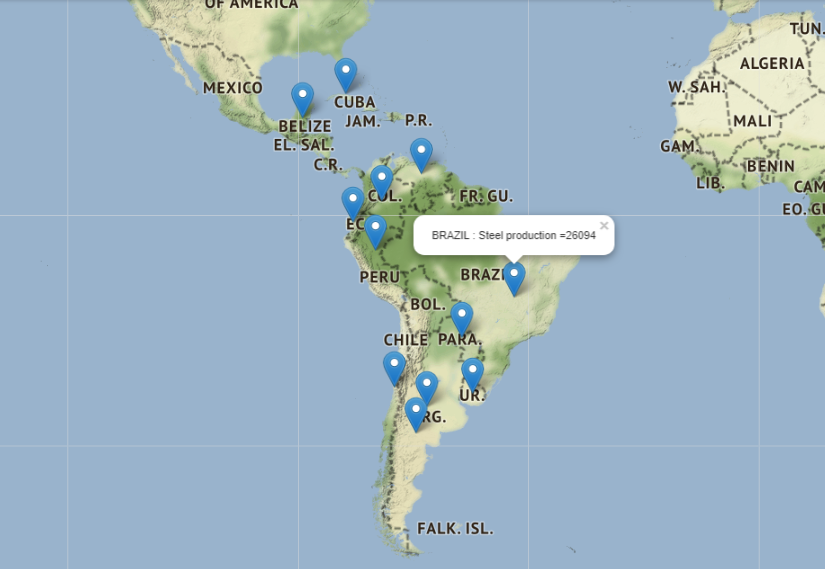
To print the stats in the map, I used the code bellow. I used the dataframe to pass the coordinates to the map.
The system creates a beautiful map. When we click in the mark-flag the system presents the name of the country and it’s steel production.
Steel Products from Brazil
Because i’m in Brazil, let’s go watch what’s up here.
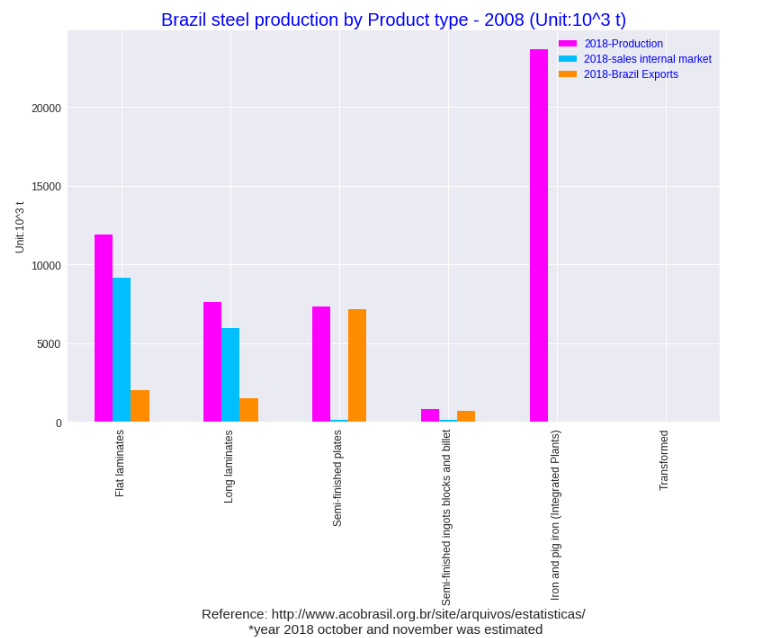
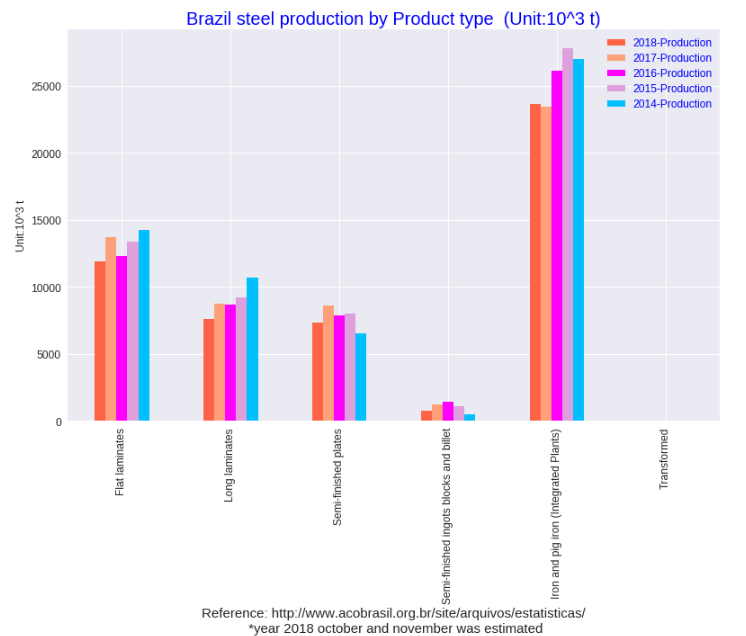
I have many informations by year, about production and sales. I make separate graphs to explore the information.
Creating subsets dataframes to make prints, in that case about production by year:
In this chart we see the same trend, that production in 2018 is lower than in 2017, in all types of steel products.
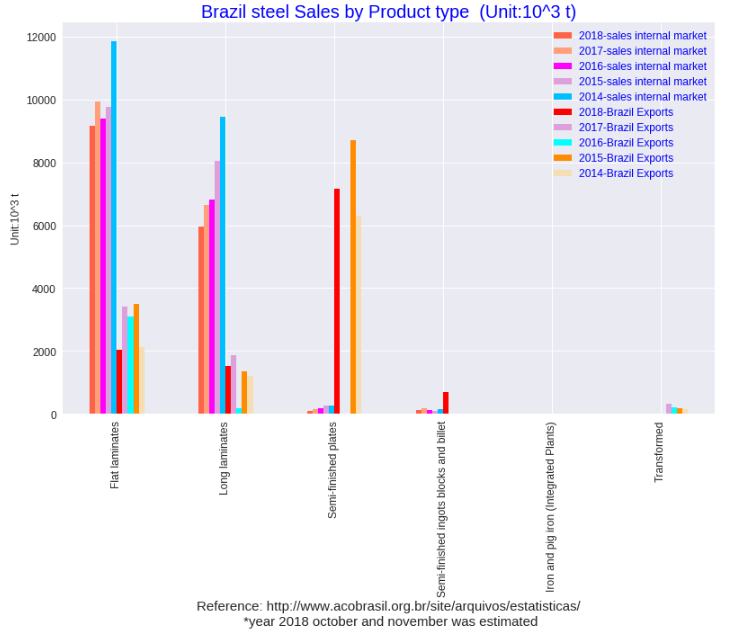
Creating a subset dataframe with Brazil Steel Sales:
Sales in 2018 are lower than in 2017, both in the domestic market and in exports.
Conclusion:
At the conclusion of this work, there is the knowledge about the steel and iron production market, the best knowledge in the Brazilian market. Printing on an interactive geographic map will be an excellent tool for presenting future work on websites.
Original article on Medium:
https://medium.com/datadriveninvestor/worldwide-steel-production-with-machine-learning-7796b423e2ea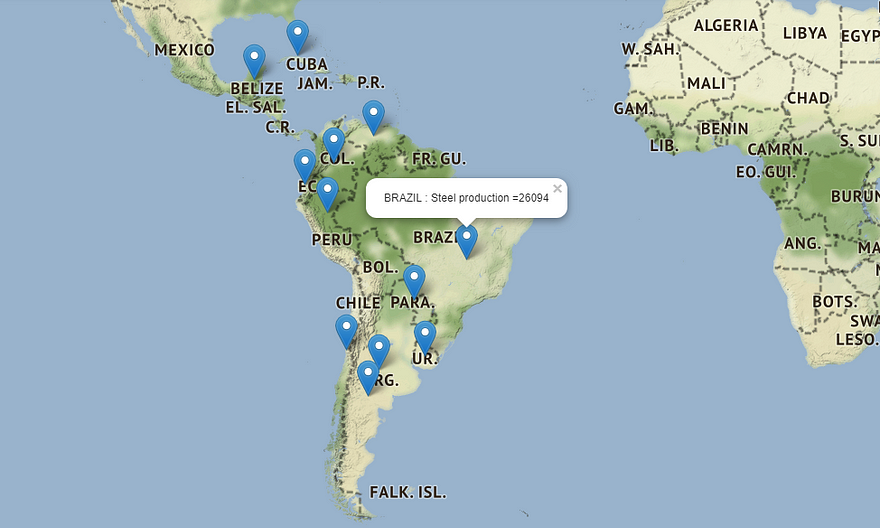








Thanks for the Valuable information.Really useful information. Thank you so much for sharing. It will help everyone. Keep Post.
ResponderEliminarUI Path Online Training
UI Path Training in Hyderabad