Using Machine Learning to analise Statistical information about Autonomous Vehicles
By Manuel Robalinho on 2018/09
Work made for my Master Degree.
The state-of-the-art documentation of the implementation of autonomous vehicles has information that I thought was important I was creating an excel sheet with the projects in progress, partnerships, country where they occur, possible investment values.
I share the file I created with you: Search_VATs.xls
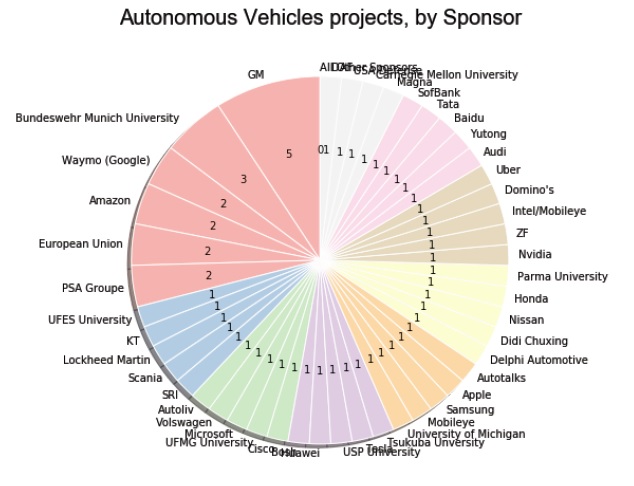
I took advantage of the information and using Python and Jupyter Notebook I created some charts with the excel information.
I had some difficulty in classifying projects funded by the European community, and I used the testing country, or the country where the company is involved in research and development of the project. Many projects are executed in partnerships, usually including software companies and automobile industry. In these cases the classification was obtained by the software developer.
Other cases being universities and companies of the automobile industry. No In this case they were classified by the origin of the University.
One unexpected case was finding 3 projects in Brazil, led by universities.
Another interesting example was to find China, Korea and Japan as a strong 3 countries in the investigation and implementation of autonomous vehicles. I believe that the high population of the Asian continent will lead the automotive industry to consider the implementation of these projects as an urgent matter.
The creation of many graphics was a way to made experiences about project the visual information, with many forms, using Phyton and pandas library, and matplotlib.
Using geographic information from libraries geopandas, and the coordinates available in geopandas datasets ('naturalearth_lowres') I made the join the world map with the country of my excel information. I plot the result of this join:
The strongest colors represent countries with more projects.
Plotting the continent names and the bar graphics bellow:
Or plotting only a big world map with the most representative countries with autonomous vehicles projects.
In another reading i found some documentation from KPMG ‘KPMG-Autonomous-Vehicle-Readiness-Index’. I liked the content and information presented, that describe the countries about openness and preparedness for autonomous vehicles.
I made an excel table with the information presented in the document, and
used the same technique described above to make some graphics, that I present now:
For me the main novelty was to have Netherland as the most prepared and developed country for the implementation of autonomous vehicles. Perhaps because we heard a lot about the projects in the USA, Germany or Japan, I did not know all the preparation that this country has already developed in this goal. Another country that it’s a surprise for me it’s the good position of Singapore and United Arab Emirates. I don’t have knowledge about projects developed in these countries.
In the two graphics it’s notorious the bad position occupied by big countries like Brazil, India, Mexico and Russia.
In that graphics we can confirm the good technologic and innovation ranking occupied by United States and Germany. In the bad positions the same countries Brazil, India, Mexico and Russia.
In this chart is interesting the good position of Brazil and the bad positions of Japan or Spain.
This chart confirms the statistics and rankings for technological development and innovation. Countries where there are cells with projects in the area, are more technologically developed.
This graph shows the inversion of some
countries in the ranking, but the values of connectivity are also very
similar among most countries. In the tail of the ranking we have the same
countries that occupy it in practically all the graphs: Brazil, India, Mexico
and Russia
Master graphic by country with the most
important scores.
The darker colors
represent the countries with the best scores.