ML Visuals is a new collaborative effort to help the machine learning community in improving science communication by providing free professional, compelling and adequate visuals and figures.
ML Visuals is a new collaborative effort to help the machine learning community in improving science communication by providing free professional, compelling and adequate visuals and figures.
You are free to use the visuals in your presentations or blog posts. You don’t need to ask permission to use any of the visuals/figures but it will be nice if you can provide credit to the designer/author (author information found in the slide notes). Check out the versions of the visuals below.
This is a project made by the dair.ai community. The latest version of the Google slides can be found in this GitHub repository. Our community members will continue to add more common figures and basic elements in upcoming versions. Think of this as free and open artifacts and templates that you can freely and easily download, copy, distribute, reuse, and customize to your own needs.
25 de maio de 2020, 19h - 29 de maio de 2020, 09h30
Será na semana de 25 a 29 de Maio de 2020 às 19h, compartilharemos com amigos, interessados em dados e toda a comunidade, muito conhecimento e troca de experiências em lives todos os dias no canal do YouTube do Grupo GPDI Brasil.
The goal is to use machine learning to create a credit score for customers. This score gives the degree of confidence that the customer will meet the agreed payments. The higher the score, define the greater the probability of non-payment.
Multiple Linear Regression in Python with Scikit-Learn
We just performed linear regression in the above section involving two variables. Almost all the real-world problems that you are going to encounter will have more than two variables.
Linear regression involving multiple variables is called “multiple linear regression” or multivariate linear regression. The steps to perform multiple linear regression are almost similar to that of simple linear regression.
We will use customer information to generate a ‘trust’ score on the customer. The scoring formula can be adapted for each company according to its credit context. In this example, we are going to use the average number of days the customer is late, and the average billing amount for the past 2 years to calculate a score that combines the 2 information.
After calculating the score, we submit the information to a machine learning with Scikit-Learn, so that the system can predict new scores based on the learning information.
State, Region, Postcode, Salesman, Main CNAE (type of company classification in Brazil)
Highest Billing Date
Maximum billing amount
Last Date invoice issued
Largest credit exposure date
Highest credit exposure
Average historical delay
Average revenue last 48 months
Amount payable Overdue
Amount payable due
Customer Last Order Date
Date of this information
SERASA Information
( Serasa it’s a company that sell’s information about other companies)
Serasa Score
Probability of not paying
Last date non payment
Amount of unpaid documents
Value of unpaid documents
Last date bad checks
Amount of bad checks
Last date protests
Value protests
Last date judicial actions
Value judicial actions
Last date overdue debts
Value overdue debts
I create some Python code to read and clean data from my data set.
After we create a routine to read all records and calculate my score (newscore) using my definitions. I have an excel file with my definitions to calculate my score.
Applying Keras-Model to training and test the model. Create Train and Test datasets, 80% for Train and 20% to Test. In graphic mode, we can compare Train and Test results:
I need to predict some individual records, so, I made a python function to predict score:
Now testing, running to predict my record:
Using tkinter python library, we can create a screen with better visual:
Conclusion:
The creation of a score using the information known to a customer, can automate and make a credit system more reliable. This approach contributes to cooler and more reliable risk analysis, resulting only from market data and information, removing from the system the criteria of proximity to the client and the emotions that negotiation can generate.
Steel is the world’s most important engineering and construction material. It is used in every aspect of our lives. There are more than 3,500 different grades of steel with many different physical, chemical, and environmental properties. The European environmental initiative on raw materials (Council, European Parliament and, 2003) has recently promoted the efforts in recycling and recovery of metal alloys. I used spectral images of scrap steel to make an efficient classification using Machine Learning techniques.
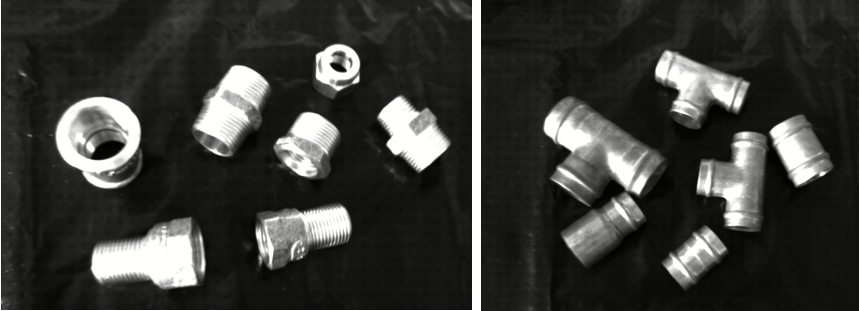
The materials used were aluminum, brass, copper, iron, stainless steel, and painted iron materials to obtain multi-spectral images. The used equipment is a multi-spectral machine, ADC Lite. The ANACONDA framework was installed to use Jupyter with Python programming. The exploration of the bands of the images focuses on the analysis of the matrices of the images, in order to obtain classification parameters for the different materials.
Some multi-spectral images from material brass and copper (images from the author)
The classification of scrap metal is a very economically relevant task,
both for society and for the industrial area. Although scrap is a waste society or industrial area, is a valuable product. We also have the issue management of solid waste from metal products at the end of life, which is an objective of all citizens and has specific incentives for some European projects.For the steel industry, the cost of producing steel from scrap is much lower than steel from primary raw materials (iron ore). These companies use the scrap as an alternative to increasing their production volumes, reduce fixed and even variable costs since, in general, scrap is a source of metal economically advantageous, especially in regions where energy costs are very high, for example, in the United States and Europe.
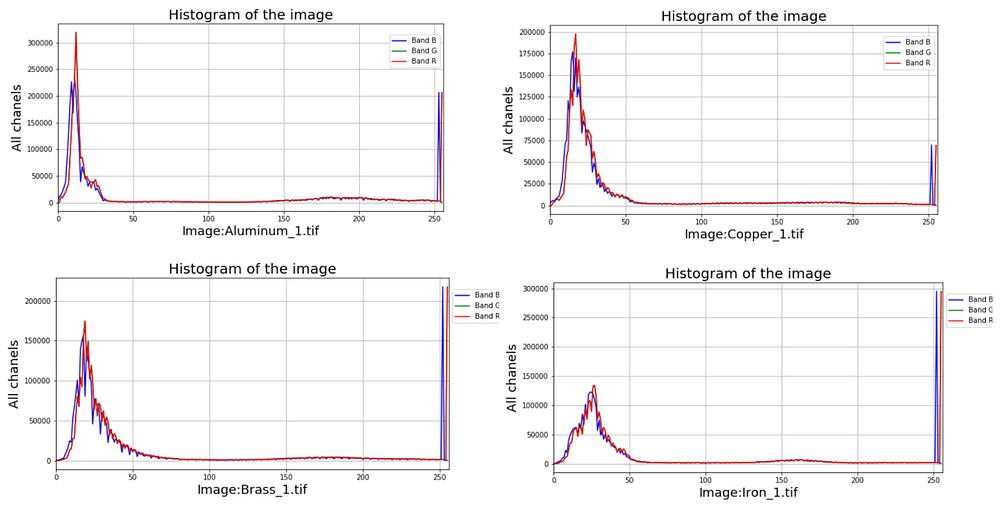
The transformation of the RGB bands of an image into matrices and lists allows an approach with Machine Learning, and the differences between the spectral bands of the different materials can be exploited mathematically. Several libraries available for image processing allow exploration at the level of the representative matrices of an image, its color and the reflectance as exposed to the incidence of light.
Some graphs that use the multi-spectral image information of the scrap metal (images from the author)
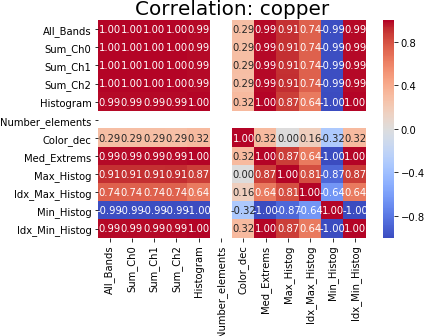
The ANACONDA framework was installed for use by Jupyter with programming in Python. The exploration of the bands of the images focuses on the analysis of the images, in order to obtain the classification parameters for the different materials. Other approaches could be to use Google Collaboratory, which provides a virtual machine Python in the cloud and already incorporates an environment with GPU. For applied techniques, it was necessary to install Python libraries, such as: PILLOW, OPENCV, OPENPYXL, COLORMATH, WEBCOLORS, NUMPY and MATPLOTLIB. These libraries provide a set of facilities that allow us to analyze different issues and develop a specific approach to each problem.
An example, correlation graph about some characteristics of copper, obtained using Python. (images from the author)
Conclusions:
It is possible to classify metals using ML techniques, as described. Other technical issues like correct scrap viewing; an environment with rain protection; and light suitable for capturing images, should be observed. In an industrial environment, we have service routines intense and high-speed equipment. High levels of dust, noise, and vibration are common in these environments and need to be considered in a future prototype application.
References
Research is done by the author. Work developed for a Position Paper, university master’s work.
Diretiva 2012/29/UE do Parlamento Europeu e do Conselho, de 25 de outubro de 2012, Council, European Parliament and. (2003). WEEE Directive 2002/96/EC. Eionet — Reporting Obligations Database. Source: http://ec.europa.eu