
Testing some functionality from package folium to making interactive geographic graphs with statistical information, I found the APP datawrapper, which can make it easy and that in a moment of having to be practical and efficient to make a presentation … may be the solution.
The datawrapper APP creates interactive graphs including your stats information. You have a screen to input you data by country, by region, or you can import your csv table.
You can configure your title, your labels, put your source information, configure colors, and insert tooltip information when the mouse its in the country.
Because I’m studying about steel, I have some statistical information about world steel production in 2018, obtained here and in that web page.
According to information from the company that manages the wep page consulted, the data was obtained based on actual production data until October 2018 and projecting November and December 2018.
Plotting the information in a Geographic map
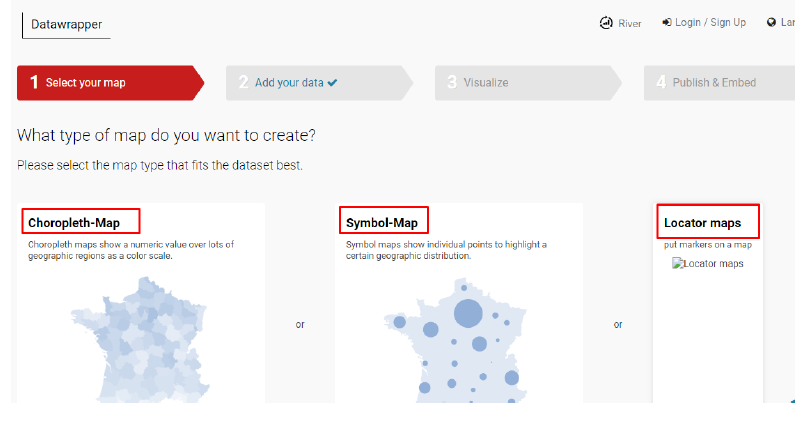
- 1.Select map type on https://app.datawrapper.de
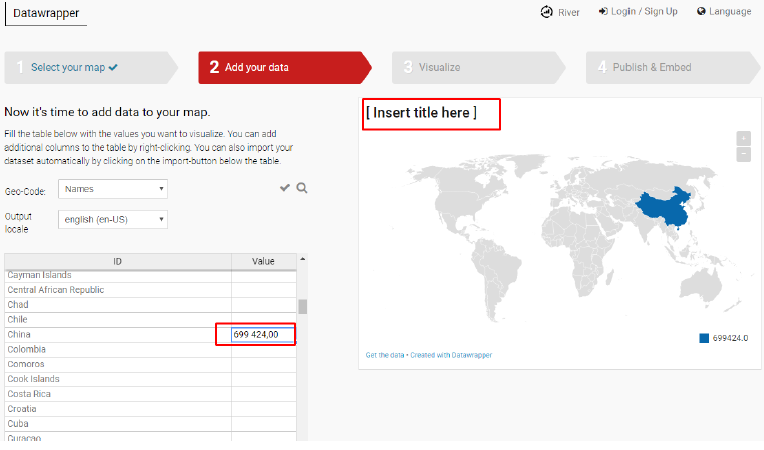
2. Write your data in the left table
3. Configure your title, color and notes

4. Customize your tootlip information
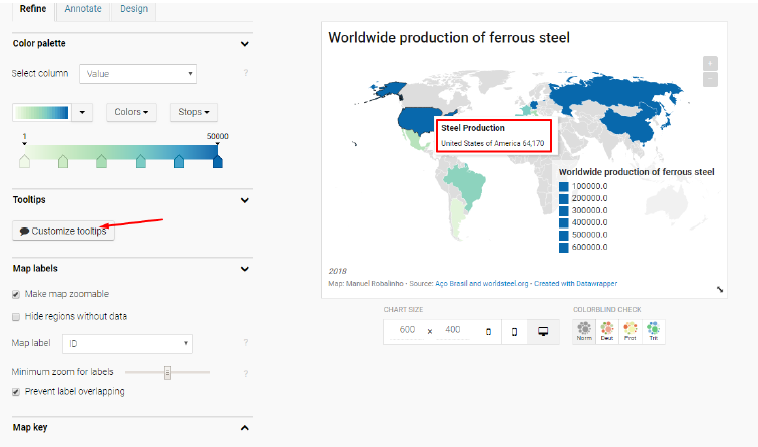
5. Customize your legends

6. Publish your map
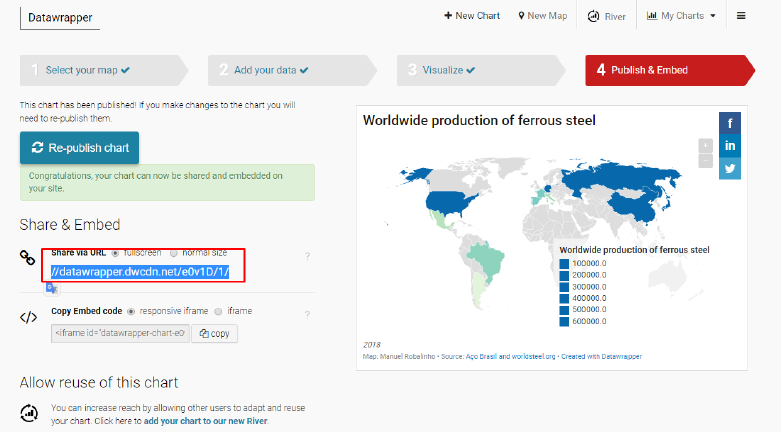
You obtain an link or an embed code, to put in your website.
Conclusion:
Easy, very easy. Beautiful and useful APP. Look here…
Original article on Medium:
https://medium.com/datadriveninvestor/placing-statistics-on-geographic-maps-can-be-simple-d9c6d573b5ae
Sem comentários:
Enviar um comentário